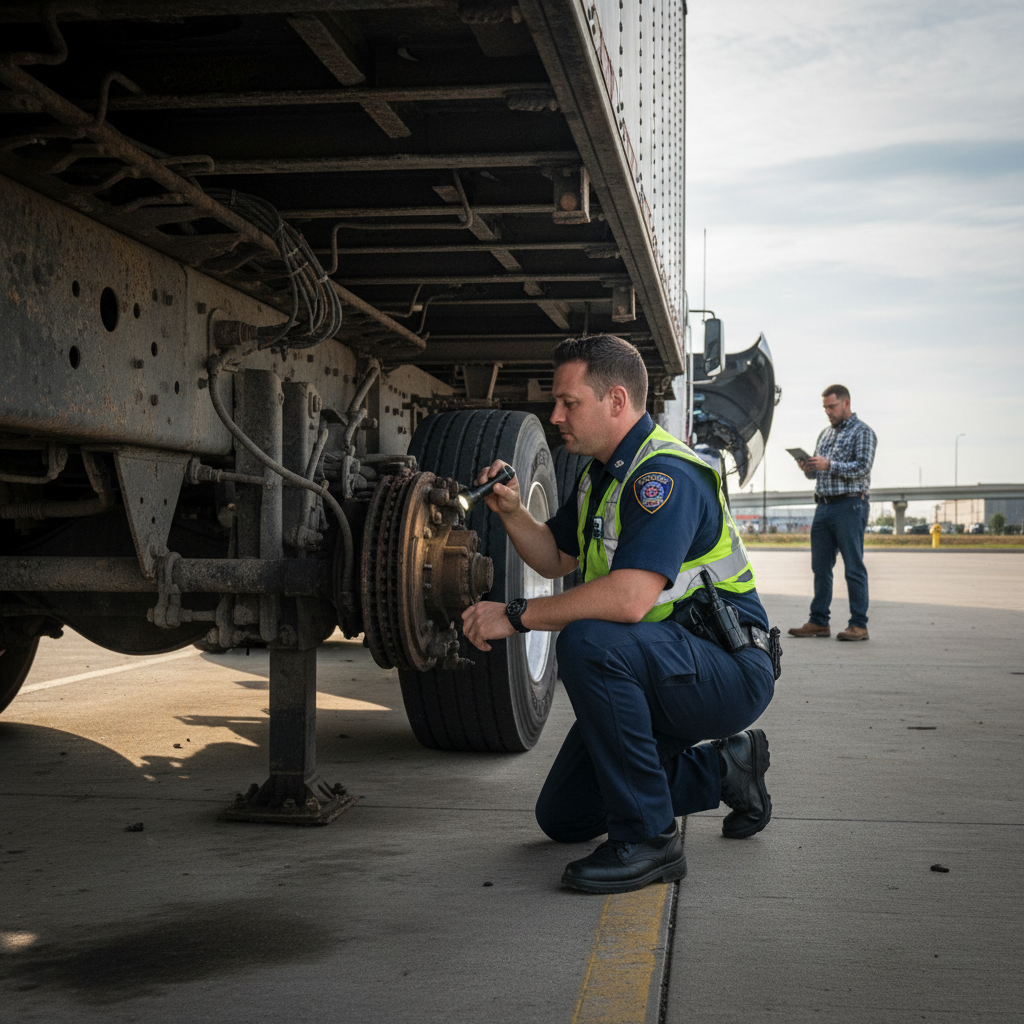
A regional flatbed carrier in the Southeast renewed its commercial auto and cargo policy in Q1 2025 and got hit with a 23% premium increase. Their loss ratio was clean. No at-fault accidents in 18 months. The underwriter's explanation referenced "telematics risk indicators" — and when the fleet's director of maintenance pushed back, he got a three-page data summary that included recurring SPN 3251 / FMI 0 events (aftertreatment diesel particulate filter differential pressure above normal) across six of their Class 8 Freightliners, along with a pattern of SPN 5246 / FMI 0 (NOx outlet sensor above normal range) that had persisted for over 90 days without resolution.
The fleet wasn't in violation of anything. The trucks were running. But to the underwriter's risk model, those codes told a story: deferred emissions maintenance, potential for thermal events, and a maintenance culture that tolerates known fault conditions. That's now a pricing variable.
How Underwriters Went From Accident History to Fault Code Patterns
Commercial fleet insurance has historically priced risk using lagging indicators — accident frequency, DOT inspection violations, CSA scores, driver MVRs. All of that data arrives after something has already gone wrong. The shift that's underway in 2025 is toward predictive inputs, and fault code telemetry is the richest predictive dataset available at scale.
Insurers working with telematics partners — including programs through major carriers like Samsara, Geotab, Motive, and Spireon — are now ingesting J1939 fault data directly from ECU broadcasts, not just summary reports. The distinction matters. A weekly summary might show three fault events. The raw J1939 stream shows whether those events were isolated spikes or part of a pattern with escalating FMI severity, whether they were cleared without repair (passive resets), and whether the same SPN recurred on a shorter interval over time.
That recurrence interval is exactly what actuarial models care about. A fault that appears once every 60 days looks very different from one that appears every 11 days over a four-month window. The second pattern suggests a deteriorating component and correlates — in underwriter models — with increased probability of a roadside failure event, which itself correlates with accident exposure.
The Specific Fault Families Being Scored
Not all fault codes carry equal weight in risk models. Based on conversations with fleet risk consultants and publicly available insurer program documentation, the following categories are receiving the most attention in 2025:
Brake system faults. SPN 1633 (brake control component fault), SPN 2791 (EBS actuator), and ABS-related SPNs from the SA (source address) 11 broadcast are being flagged when they appear repeatedly without corresponding repair records. An air brake system emitting SPN 1791 / FMI 5 (brake pressure sensor, current below normal) that isn't addressed within 30 days is now a specific trigger in some programs.
Engine thermal management. Recurring SPN 110 / FMI 0 (engine coolant temperature above normal) events, particularly those that precede torque derate events logged under SPN 1127, indicate a cooling system that's been marginalized. These are strongly correlated with unplanned roadside breakdowns — the kind that result in a truck stopping in a travel lane.
Aftertreatment and emissions. As noted in the opening scenario, DPF and SCR faults that persist across multiple data uploads without resolution are being scored as maintenance compliance indicators. The logic: if a fleet tolerates known emissions system faults for 90 days, what does that say about how they treat brake fade thresholds or tire pressure deviations?
Tire inflation systems. ATIS-related faults on tractors equipped with automatic tire inflation systems, particularly repeated SPN 1266 or manufacturer-specific PGN broadcasts indicating persistent low-pressure conditions, are flagging fleets as potential blowout risks — and blowout-related accidents carry catastrophic tail risk that insurers price aggressively.
Data Quality Works Against You in Ways You May Not Expect
Here's the part most fleet managers miss: the absence of fault data can be scored as risk, not neutrality.
If your telematics system shows extended periods of sensor silence across a vehicle population — no J1939 broadcasts, no PID responses, clean data gaps that don't align with known downtime — underwriters are beginning to treat that as a data integrity problem. And a fleet with data integrity problems gets penalized twice: once because insurers can't confirm maintenance compliance, and once because the gap itself is suspicious.
This is directly tied to how telematics data quality determines AI prediction accuracy in fleets. The same data gaps that degrade your predictive maintenance models are now degrading your insurance risk score. The two problems are the same problem.
Sensor dropout is a real operational issue, and it's more common than most shops realize. Dead PIDs, module communication gaps, and intermittent MIL lamp logic can all produce clean-looking data that is actually missing critical fault history. Understanding sensor dropout patterns and dead PIDs in your telematics feed isn't just a data hygiene issue anymore — it's a risk management issue with direct premium implications.
The Scenario That's Defining the 2025 Risk Conversation
A 47-unit regional LTL operation running Kenworth T680s out of a Midwest terminal had a claims event in late 2024: a rear-end collision involving a heavily loaded 53-foot van trailer. The driver reported brake fade. Post-accident forensics pulled the fault history and found:
- SPN 1590 / FMI 9 (adaptive cruise control, abnormal update rate) recurring across a 60-day window prior to the accident
- SPN 1485 / FMI 2 (brake stroke sensor data erratic) logged 14 times in the 45 days before the event
- Three passive DTC resets on SPN 1633 with no corresponding shop work orders
The carrier's insurer denied the full claim on the basis of known, unaddressed brake system fault history. That denial is now in litigation. But the broader consequence: the insurer flagged the fleet's entire book of business, and renewal pricing reflected a fault code risk surcharge that the policy language — rewritten in 2024 — explicitly authorized.
This is not theoretical. It's the legal and contractual framework being written into commercial fleet policies right now.
What Your Fault Code History Actually Communicates
Underwriters aren't reading individual DTCs. They're reading patterns, and patterns communicate three things:
1. Maintenance responsiveness. How quickly does the fleet act on fault events? A model that scores average time-to-resolution across fault severity levels is measuring your maintenance culture, not just your maintenance records.
2. Fault recurrence rates. A fault that's addressed and doesn't return demonstrates effective repair. A fault that returns within 30 days of a reset suggests a surface-level fix — clearing codes without replacing the component. Injector return flow faults are a classic example. Clearing P0087 (low fuel rail pressure) without replacing the lift pump means the code comes back, and each return shortens the interval. That escalating frequency pattern is exactly what risk models are designed to detect.
3. Fleet-wide patterns vs. isolated events. One truck with a chronic cooling fault is a maintenance backlog problem. Six trucks with similar SPN 110 event patterns suggests a fleet-wide practice of running equipment past temperature thresholds — higher-order deferred maintenance. The fleet-wide signal carries disproportionate weight in risk scoring.
What to Do With This Before Your Next Renewal
The practical response isn't to clean up your data to look good to insurers. That's a short game that doesn't survive forensic review after a claim. The practical response is to build the internal processes that make your fault code history an asset rather than a liability.
First, establish fault severity tiers with defined resolution windows. Brake system faults and thermal management faults should have mandatory shop review within 48–72 hours of first detection. Emissions faults, depending on regulatory exposure, within 7–14 days. This isn't just good maintenance practice — it's the documented response pattern that underwriters want to see.
Second, document passive resets explicitly. If a code is cleared for diagnostic purposes and the vehicle is returned to service pending a parts order, that decision needs to be captured in your DMS with a timestamp and a responsible technician. Undocumented resets are the single biggest red flag in a fault code audit.
Third, understand what your telematics system is and isn't capturing. The difference between J1939 and OBD-II data capture across heavy and light vehicles matters here — mixed fleets using light-duty vehicles on OBD-II may be producing fundamentally different data structures that risk models interpret differently. If you have a mixed fleet and your insurer is applying a uniform scoring model, that's a conversation worth having with your broker.
Fourth, pull your own fault code history before your underwriter does. Most fleets can run a 90-day fault report by VIN through their telematics platform. Look for the three patterns described above: high recurrence intervals, passive resets without repair records, and fleet-wide SPN patterns across similar vehicle specs. What you find is what your insurer's model is finding.
The Bottom Line
Fault code history is now a formal insurance risk input, not a compliance footnote. Underwriters are scoring recurrence intervals, reset-without-repair events, and fleet-wide SPN patterns using the same telematics data your shop generates every day. A clean accident history no longer neutralizes a deteriorating fault profile — the two are being scored independently, and a bad fault history can drive premium increases even when your CSA scores and MVRs are clean.
Routiq gives fleet managers exactly this kind of fault pattern visibility — recurring SPNs by vehicle, resolution timelines, and fleet-wide diagnostic trends — before those patterns become an underwriter's risk narrative. You can start reviewing your fleet's fault history at rooutiq.com/register.