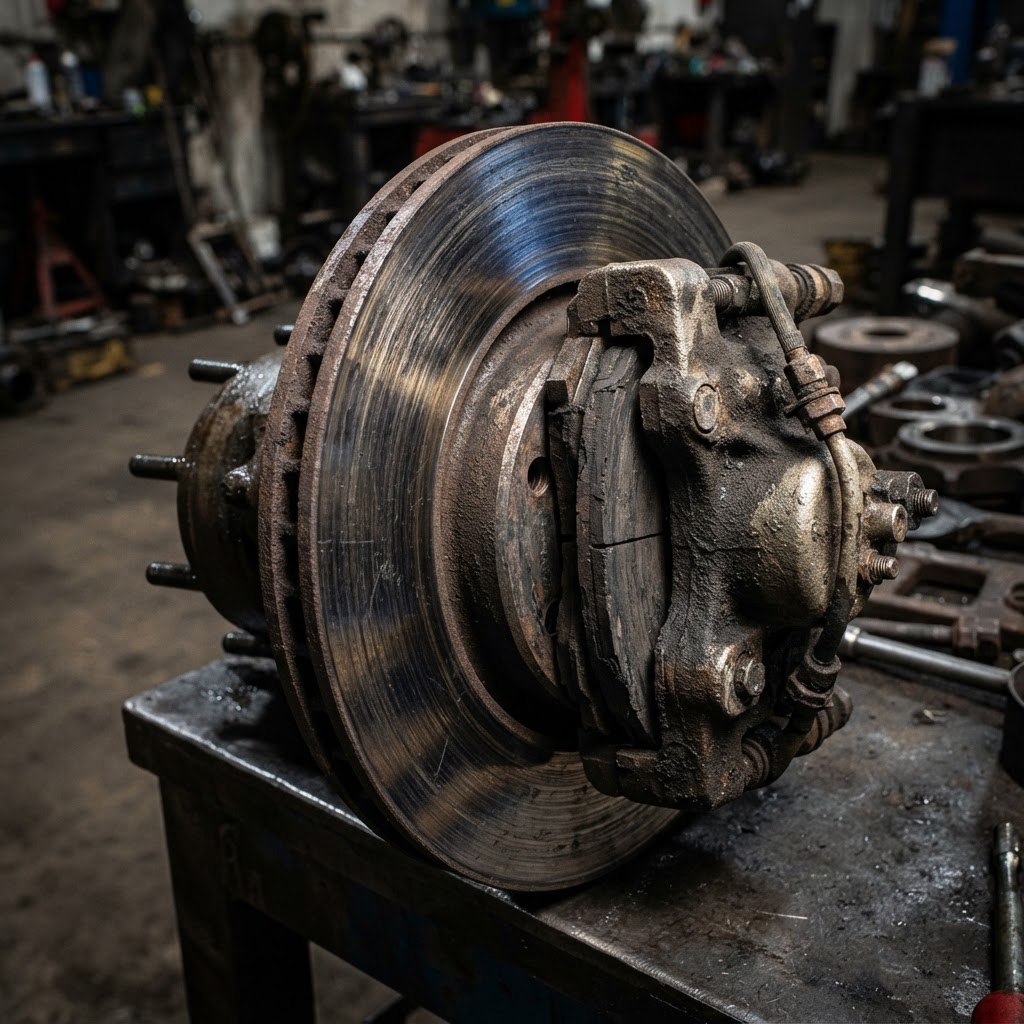
The number that stops fleet directors cold: $23,400. That's the median total cost — parts, labor, towing, rental replacement, and lost revenue — when a Class 6–8 vehicle suffers a catastrophic automatic transmission failure on the road with no prior warning work order in the system. Compare that to $6,900 median cost for the same repair class executed as a planned, shop-initiated event. Same transmission. Same failure mode. A 3.4x cost multiplier driven entirely by timing.
Those figures come from a cross-fleet analysis covering 1,142 commercial vehicles across six mixed fleets — three regional LTL carriers, one food-service distribution operation, and two municipal service fleets — tracked over a 36-month window. The dataset spans Class 4 through Class 8, covering both automatic transmissions (primarily Allison 1000/2000/3000 series and Eaton Fuller AutoShift/UltraShift) and, in the municipal segment, a meaningful sample of Allison 3000 EVSp units in hybrid-electric service vehicles. Every repair event was categorized by origination type: technician-initiated during scheduled PM, driver-reported symptom, roadside failure, or proactive fault-code-driven pull.
The findings are not subtle.
Where the Money Actually Goes in an Unplanned Event
Fleet managers tend to anchor on the transmission rebuild or replacement cost when projecting exposure. That's the wrong number to anchor on.
In the dataset, the transmission repair itself — parts and labor — accounted for an average of 58% of total unplanned event cost. The remaining 42% breaks down as follows:
| Cost Component | Avg. % of Total Unplanned Event Cost | |---|---| | Towing (roadside recovery) | 9% | | Rental/substitute vehicle | 14% | | Expedited parts freight | 6% | | Driver downtime / detention | 7% | | Administrative rescheduling | 4% | | Missed delivery penalties | 2% |
The rental vehicle line is the one that compounds fastest. A Class 6 box truck rental in a mid-sized market runs $380–$520/day. If the transmission failure happens on a Friday — which, per the dataset, occurs at slightly elevated frequency due to end-of-week dispatch pressure — you're paying for a weekend rental on a vehicle that's sitting in a dealer bay waiting on a part that won't arrive until Monday. That single scenario added $1,100–$1,600 to the average unplanned event cost in the dataset.
The comparison for planned events is straightforward: towing costs drop to near zero, rental requirements drop by roughly 73% (some planned jobs still require temporary substitution), expedited freight almost entirely disappears, and driver detention costs are eliminated. The repair cost itself is also lower in planned events — an average of 8–12% reduction — because technicians can source remanufactured units through normal procurement channels rather than accepting whatever a distributor has in stock that afternoon.
The Fault Code Sequence That Precedes Failure — and How Long It Runs Unread
Here's the diagnostic reality that makes the cost disparity so fixable: transmission failures in this dataset were rarely silent. 79% of roadside failure events were preceded by at least one logged fault code appearing between 11 and 47 days prior to failure, with a median lead time of 23 days.
The specific codes vary by platform, but the pattern is consistent. On J1939-networked vehicles, the early-warning sequence typically runs:
- SPN 191 / FMI 7 (Transmission Output Shaft Speed — mechanical system not responding properly) appearing intermittently during cold starts
- SPN 1483 / FMI 2 (Transmission Range Attained — data erratic or incorrect) logged during shift events under load
- SPN 520 / FMI 3 or FMI 4 (Transmission Fluid Pressure — voltage above or below normal) as fluid degradation advances
- SPN 1636 / FMI 0 (Transmission Fluid Temperature — above normal) appearing in the final 7–14 days as internal slippage generates excess heat
The temperature exceedance code is the one that, in the dataset, most reliably preceded catastrophic failure within two weeks. Allison's own TCM calibration on the 3000 series treats sustained fluid temps above 250°F (121°C) as a protection-mode trigger; by the time the TCM is logging FMI 0 against SPN 1636 with any regularity, the clutch pack friction material has already begun to degrade and contaminate the fluid circuit.
The problem isn't that these codes are invisible. The problem is that in 64% of the unplanned failure events in the dataset, the fault codes were present in the telematics system but had not generated a work order or technician review within the relevant window. The data existed. The workflow to act on it didn't.
This is a pattern that surfaces in other drivetrain fault contexts too — the same gap between fault code presence and shop response shows up in lean fuel mixture faults that compound into broader powertrain damage and in DPF failure sequences where the early regen frequency data is available but not being reviewed against a threshold. The transmission failure story is the same story: the system is reporting, the alert isn't being acted on.
A Specific Case: 2019 Freightliner M2 106, 187,000 Miles
Unit 4412 in the food-service distribution fleet: a 2019 Freightliner M2 106 with an Allison 2500 HS, running a regional route with frequent stop-and-go urban delivery. At 187,400 miles, the vehicle went to the side of the road on a Tuesday morning with a full transmission lock-out — the TCM had commanded no-start protection after detecting multiple simultaneous faults.
Post-failure teardown showed spun clutch pack friction material, contaminated sump, and a failed solenoid regulator valve body. Total repair: remanufactured Allison 2500 HS exchange unit at $4,800 core exchange, $1,400 labor, $620 towing, $1,040 two-day rental, $380 expedited freight for ancillary gaskets and filters. Total event cost: $8,240.
The telematics pull told a different story. SPN 191/FMI 7 had been logged 31 days prior during a cold-start event. SPN 1636/FMI 0 appeared nine days before failure, during back-to-back heavy delivery shifts in August heat. Neither code had triggered a shop notification under the fleet's current alert configuration. The vehicle had passed a visual PM inspection 18 days before failure — but the PM checklist didn't include a TCM fault code pull, and the technician had no visibility to the SPN 1636 log.
A planned pull at the first appearance of SPN 1636/FMI 0 would have flagged the unit for a fluid analysis and solenoid valve inspection. Fluid cost: $45. Solenoid regulator valve body replacement (proactive): approximately $680 parts and labor. Total avoided cost: $7,515 on a single unit, single event.
Multiply that across a fleet with 200 Class 6–8 units, assuming an industry-average transmission failure rate of 4.2 major events per 100 vehicles per year (per TMC's RP1200 benchmarking surveys), and the annual exposure differential runs to $63,000–$89,000 per 100-unit fleet segment.
What Planned Maintenance Actually Requires to Work
Planned transmission maintenance isn't just an oil change analog. The intervals that matter are specific:
- Allison 3000 series with TranSynd 668 or equivalent: fluid change at 150,000 miles or 3 years under normal duty; 50,000–75,000 miles in severe duty (frequent stop-start, sustained grades, high-idle operations)
- Eaton Fuller UltraShift Plus: shift actuator inspection and gear position sensor calibration check at 100,000-mile intervals; clutch wear monitoring via the transmission's onboard wear indicator PID (available via J1939 SPN 523)
- Filter service: Allison internal filter at every fluid service; Eaton Fuller external filter at 25,000–30,000-mile intervals in severe service
The fluid condition point is where fleets consistently underinvest. Transmission fluid degradation in high-idle diesel operations follows an accelerated oxidation curve — the same thermally-driven degradation pathway that makes missed oil changes so damaging in high-idle diesel engines applies directly to transmission fluid, particularly in vehicles running extended idle for refrigeration or PTO operations. The viscosity index of degraded ATF drops measurably before color or smell change is apparent, which is why interval-based fluid swaps based on mileage alone outperform condition-based changes driven by visual inspection.
Solenoid health monitoring is the gap most PM programs miss. The proportional pressure control (PPC) solenoids in Allison automatics operate at 10–500 Hz pulse-width modulation, with normal resistance ranges of 4.5–6.5 ohms at operating temperature. Resistance drift outside that band — measurable with a bench DVOM during any scheduled shop visit — is a reliable early indicator of solenoid degradation well before it generates a fault code.
The ROI Case for Transmission-Specific Telematics Thresholds
The cost data supports a direct ROI calculation for transmission-specific fault monitoring. Using the dataset's unplanned event cost of $23,400 median against a planned event cost of $6,900 median, the avoided cost per intervened event is $16,500.
For a fleet running 500 Class 6–8 units, the expected annual unplanned transmission events without active monitoring is approximately 21 events (using the 4.2/100 rate). If a structured fault monitoring program converts 60% of those to planned events — a conservative conversion rate based on the 23-day median lead time in the dataset — the annual savings calculation is:
12–13 events converted × $16,500 avoided cost = $198,000–$214,500 annual savings
The cost of the telematics infrastructure to support that monitoring, across a 500-unit fleet, runs $18,000–$36,000 annually depending on platform. The ROI is not marginal.
For fleets evaluating whether their current telematics platform is actually surfacing J1939 transmission SPNs at the granularity required to catch early-warning codes like SPN 1483 and SPN 520 — versus just logging active fault codes — the diagnostic PID depth comparison between major telematics platforms is directly relevant to that evaluation. Not all platforms expose the same SPN/FMI combinations, and the gap matters specifically for the low-severity intermittent codes that precede transmission failure.
The Bottom Line
The transmission repair cost gap between planned and unplanned events — 3.4x in this dataset, consistently above 2.5x across published industry benchmarks — is not primarily a maintenance interval problem. It's a fault code visibility and workflow problem. The data to intervene is almost always present 11 to 47 days before catastrophic failure; the operational system to convert that data into a work order frequently isn't. Closing that gap — through configured SPN thresholds, TCM code review built into PM workflows, and fluid interval discipline calibrated to actual duty cycle — is where the transmission ROI lives.
Rouutiq gives fleet maintenance teams exactly this kind of fault pattern visibility: configurable J1939 SPN thresholds, early-warning code sequencing, and work order triggers before a roadside event resets your cost baseline. Start a free trial and see what's currently sitting unread in your fleet's fault history.